Import Data Sources
Objective: Gain an understanding of Data Sources and how to import them to a Work Plan.
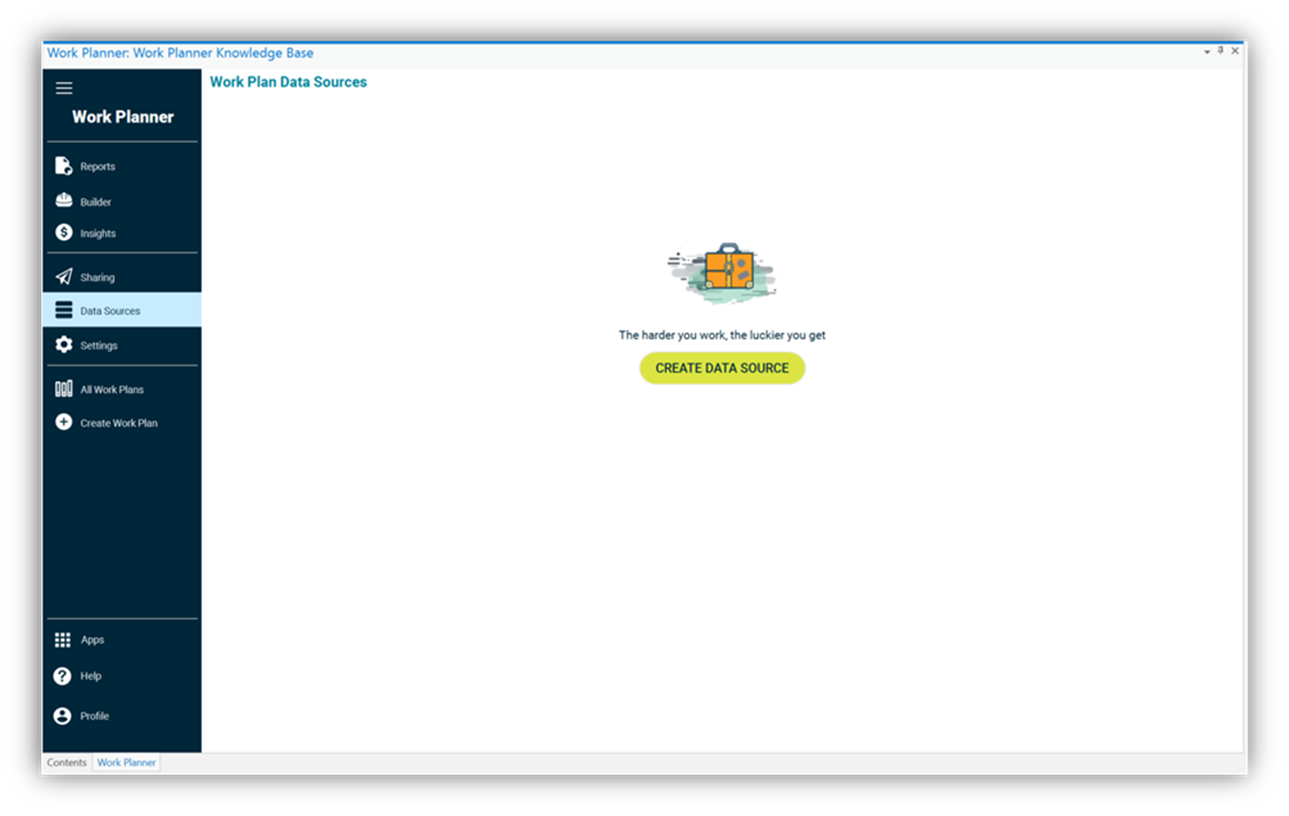
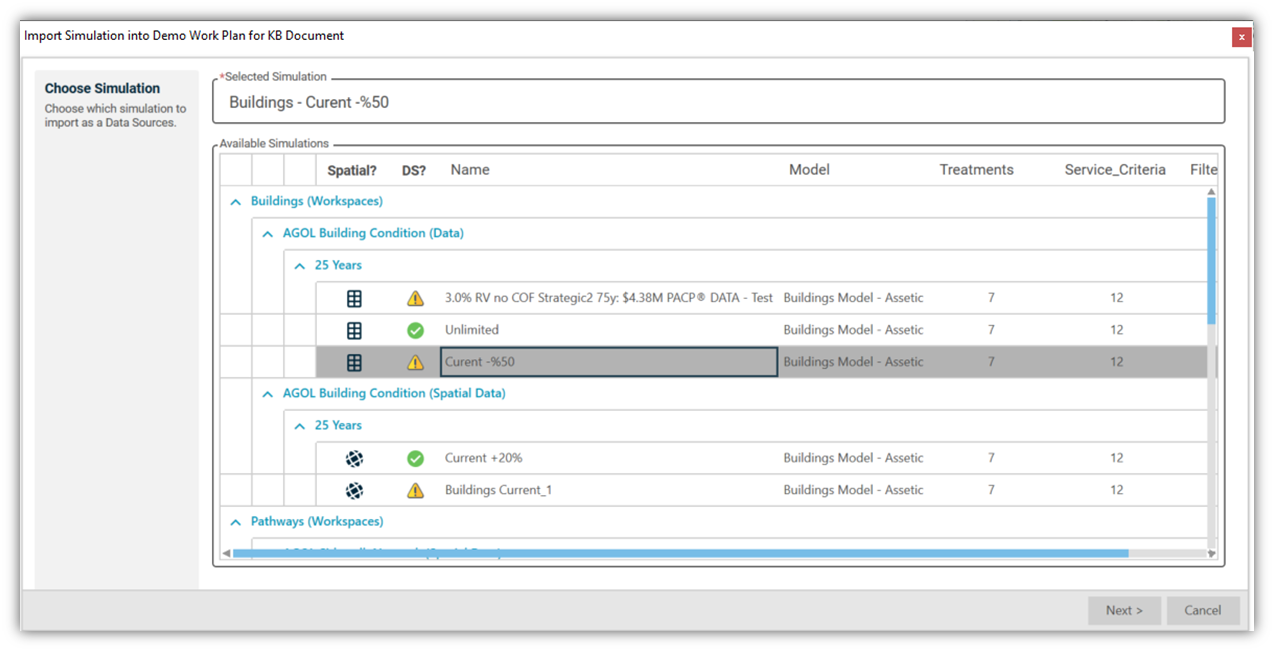
- Click on the "Create Data Source". This action will show a list of available simulations linked to the selected portfolio.
- Choose the desired simulation from the available simulations list. The Simulations are grouped by Predictor Data Source and number of Years for the Simulation.
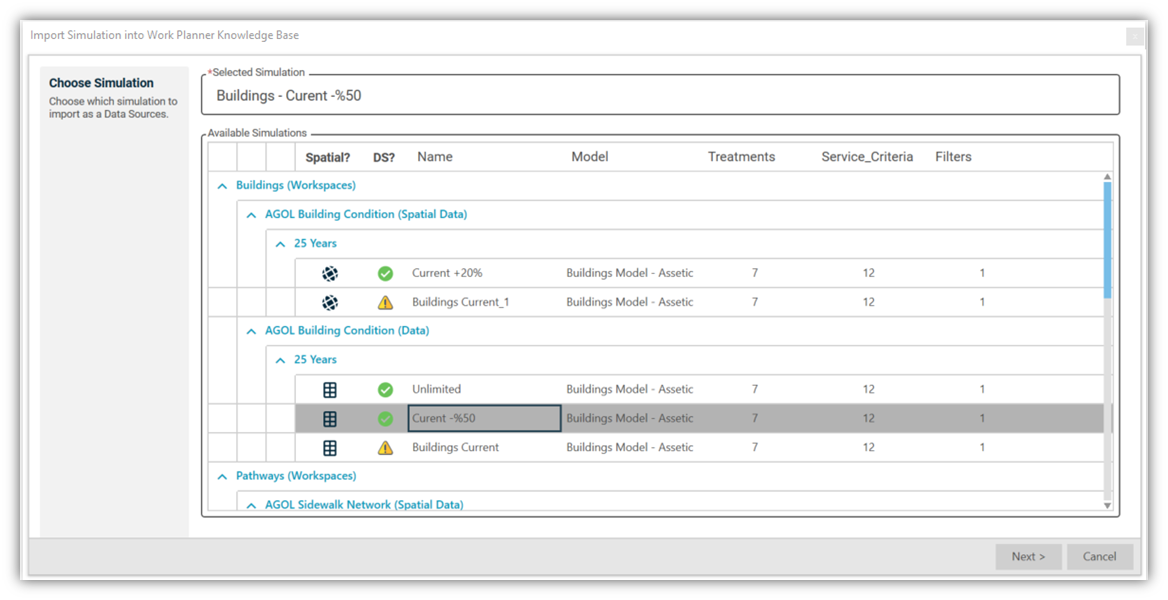
- The Import Simulations screen allows for Simulations to be imported one at a time.
Note: When selecting subsequent Simulations after importing the first, it is recommended that you choose only one simulation per Predictor Data Source and that each simulation chosen should have the same number of years.
The method for how data is imported to Predictor determines if the simulations presented in the list are spatial or non-spatial. The icon associated with the data informs the user if the data is spatial or not:
 = Spatial;
  = Non-Spatial.
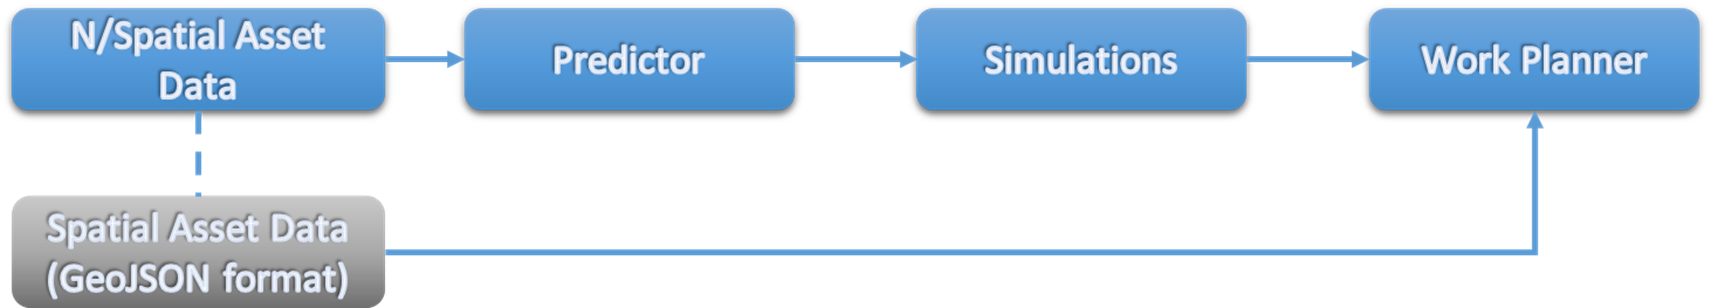
Note: For a Simulation to be spatial, data must be imported to Predictor through the Esri ArcGIS Online & ArcGIS Enterprise Integration option. Please see the following articles to learn more: ESRI Integration Configuration and Using Predictor Results Feed with ArcGIS Enterprise.
If the simulation result is in the non-spatial format, you will need to import its relevant spatial data in GeoJSON format.
Spatial format:

Non-spatial format:
- Choose a Simulation for the given period for the selected asset type and select next (e.g. Road – Current Budget +20% over 25 years). Work Planner will process the Simulation and import it.
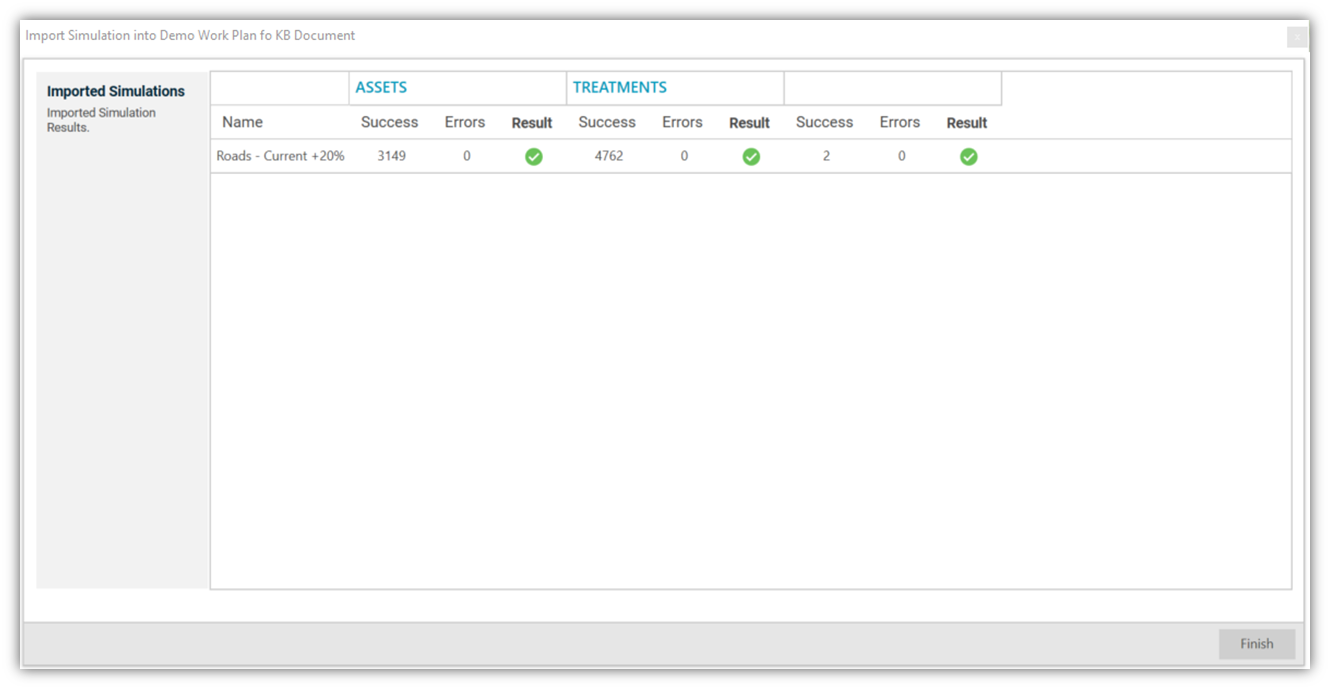
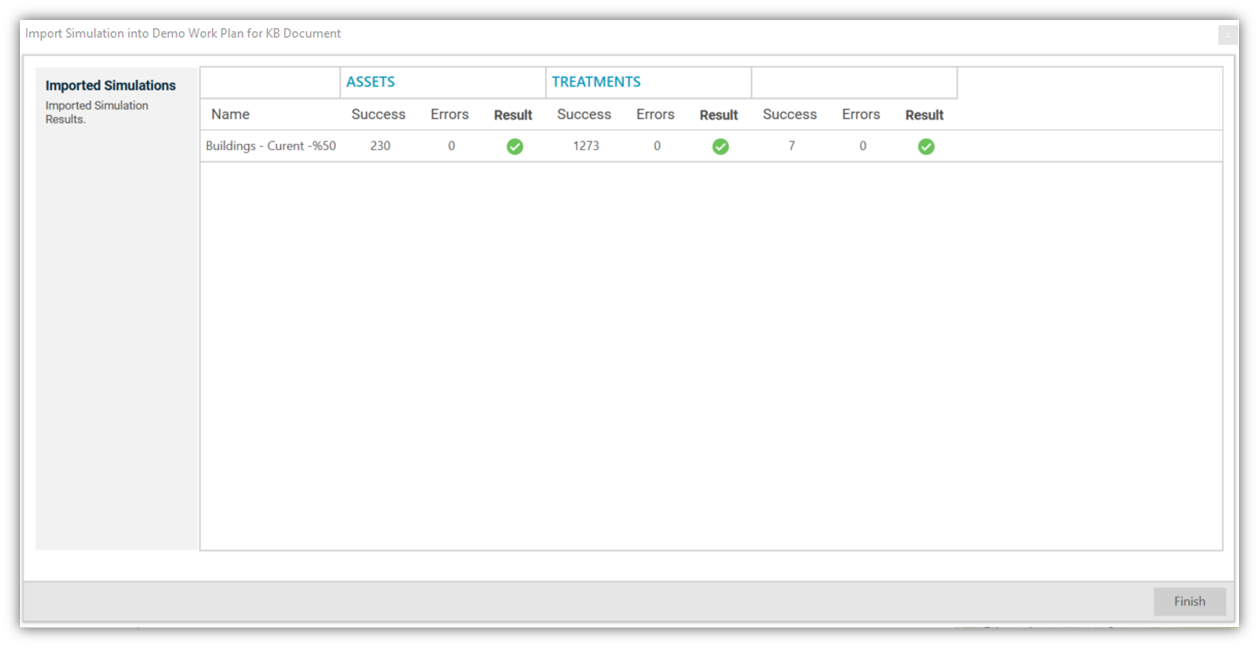
- If "Assets," "Treatments," and "Treatment Types" have been imported successfully and you see this confirmation symbol
 , click "Finish". If there are errors in importing data sources, you will need to troubleshoot the simulation before proceeding to the next step. For more information about Predictor simulations, check here. Note: Only Treatments with a date within the next 12 years from the current year (at the time of the import) will be imported.
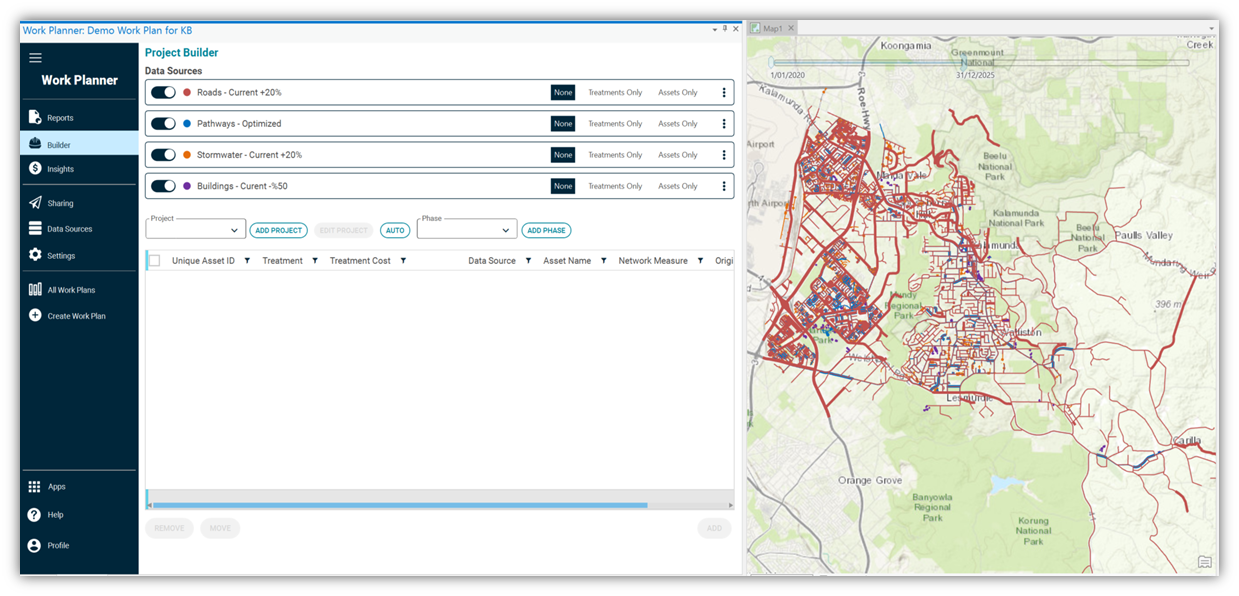
- The imported simulation appears in the Work Planner window under "Data Sources".
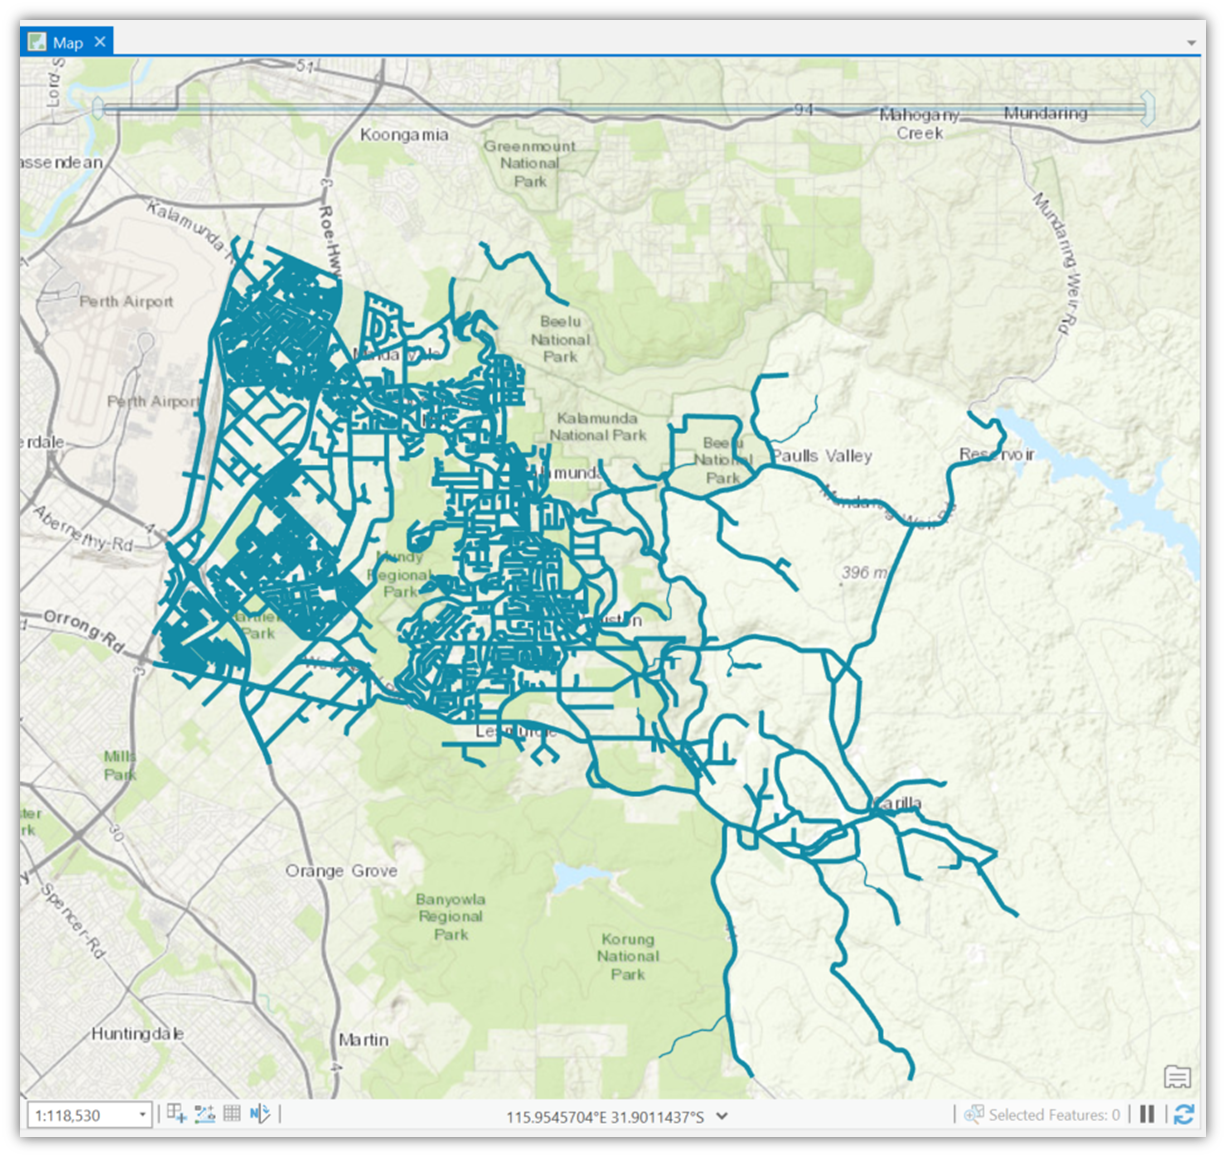
- Example of imported data in the spatial format:
By importing the source data in the spatial format, location of the imported assets and their predicted treatments will be visualized on the associated Map. The map includes all treatments over the simulation years.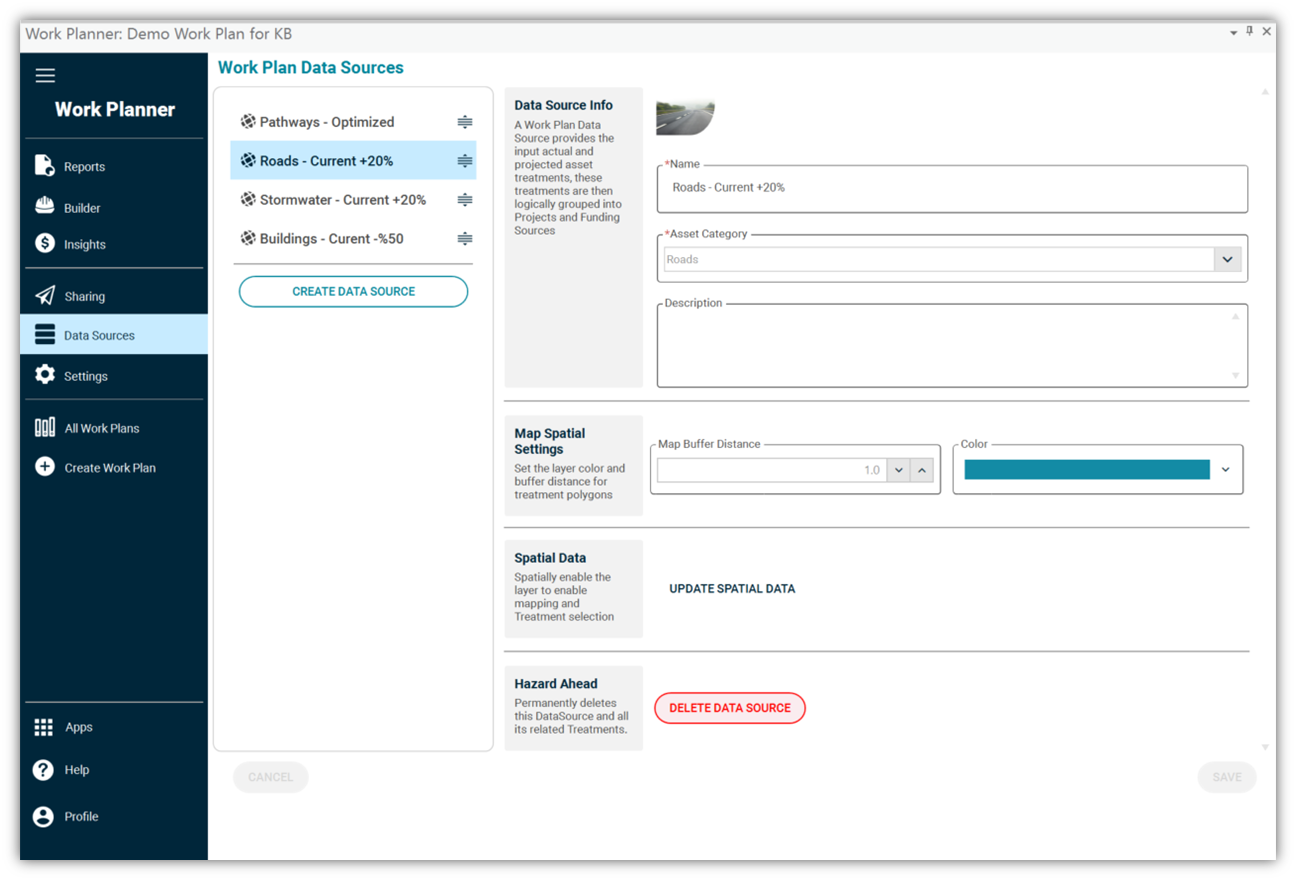
The Work Planner is designed to use the time-filter ability of the ArcGIS Pro to filter and visualize the treatmentswithin a selected timeframe that defined by the user. Following steps show the configuration of the ArcGIS Pro for visualization of the time-enabled treatments:
In ArcGIS Pro menu bar, click on the "Time" tab. You will see the work plan's time configuration tabs: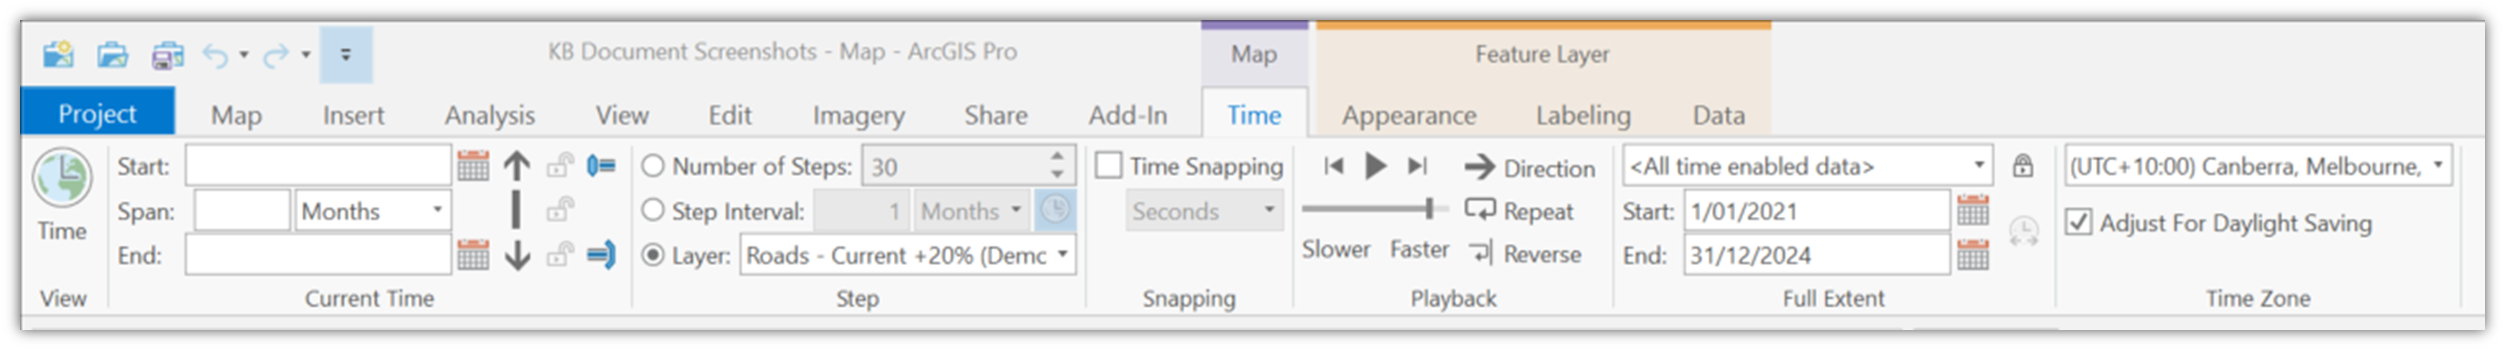
Click on the "Time" in the "View" tab to enable time filter.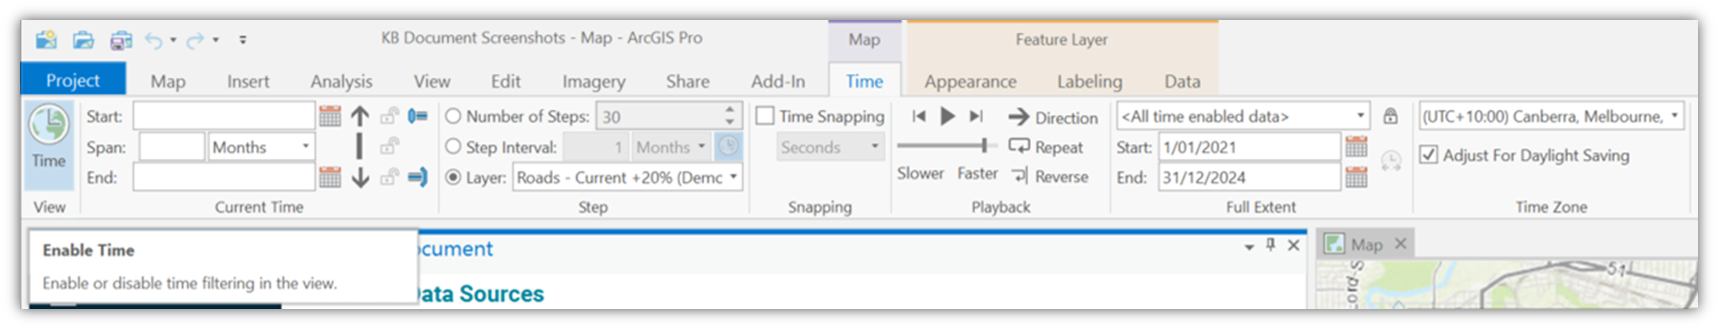
Enter the start and end of the time frame for the time filter in the "Current Time" tab: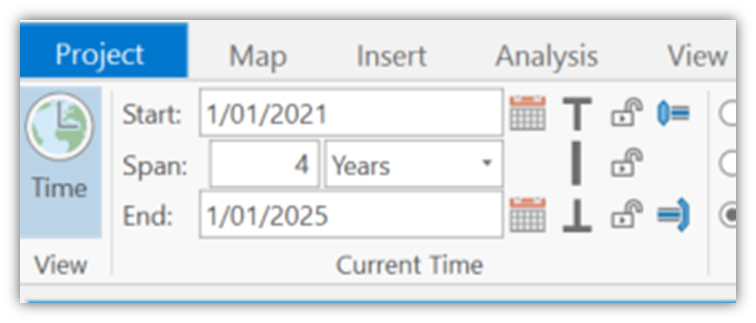
After the time filter applies, only the treatments within the selected time frame will be visualized on the map.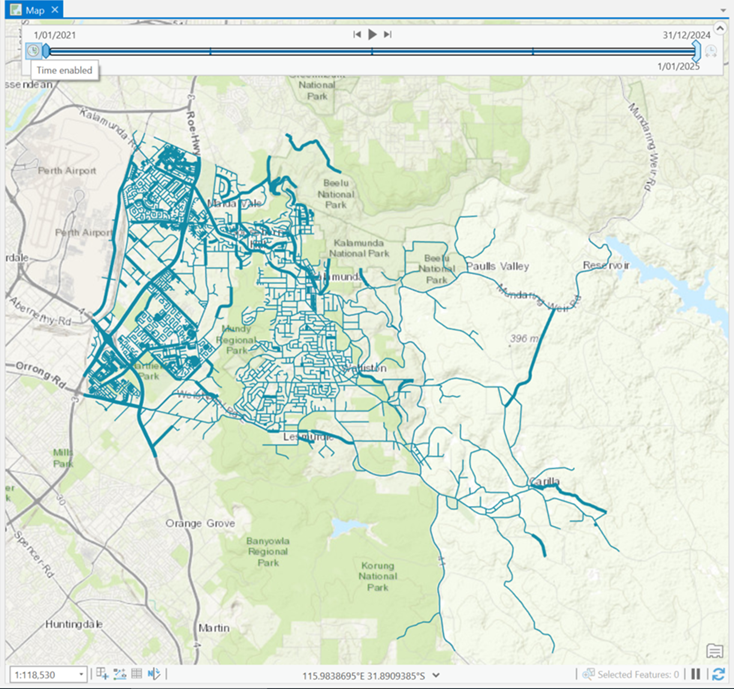
- Example of imported data in the non-spatial format:
- Example of imported data in the spatial format:
- For data sources in the spatial format, follow the instructions on the "Add Spatial data" window, "Styling" section to configure the appearance of the asset data and treatment data on the "Map" window in ArcGIS Pro. You can set the thickness of the treatments data and the color of the asset data and treatments data to your desired values. You can also change the visualization aspects of the imported data using ArcGIS Pro capabilities.
- Save the setting.
- For data sources in the non-spatial format, import the relevant spatial data in a GeoJSON format by clicking on "IMPORT SPATIAL DATA" in the "Work Plan Data Source" page. Then, configure the appearance of the spatial data.
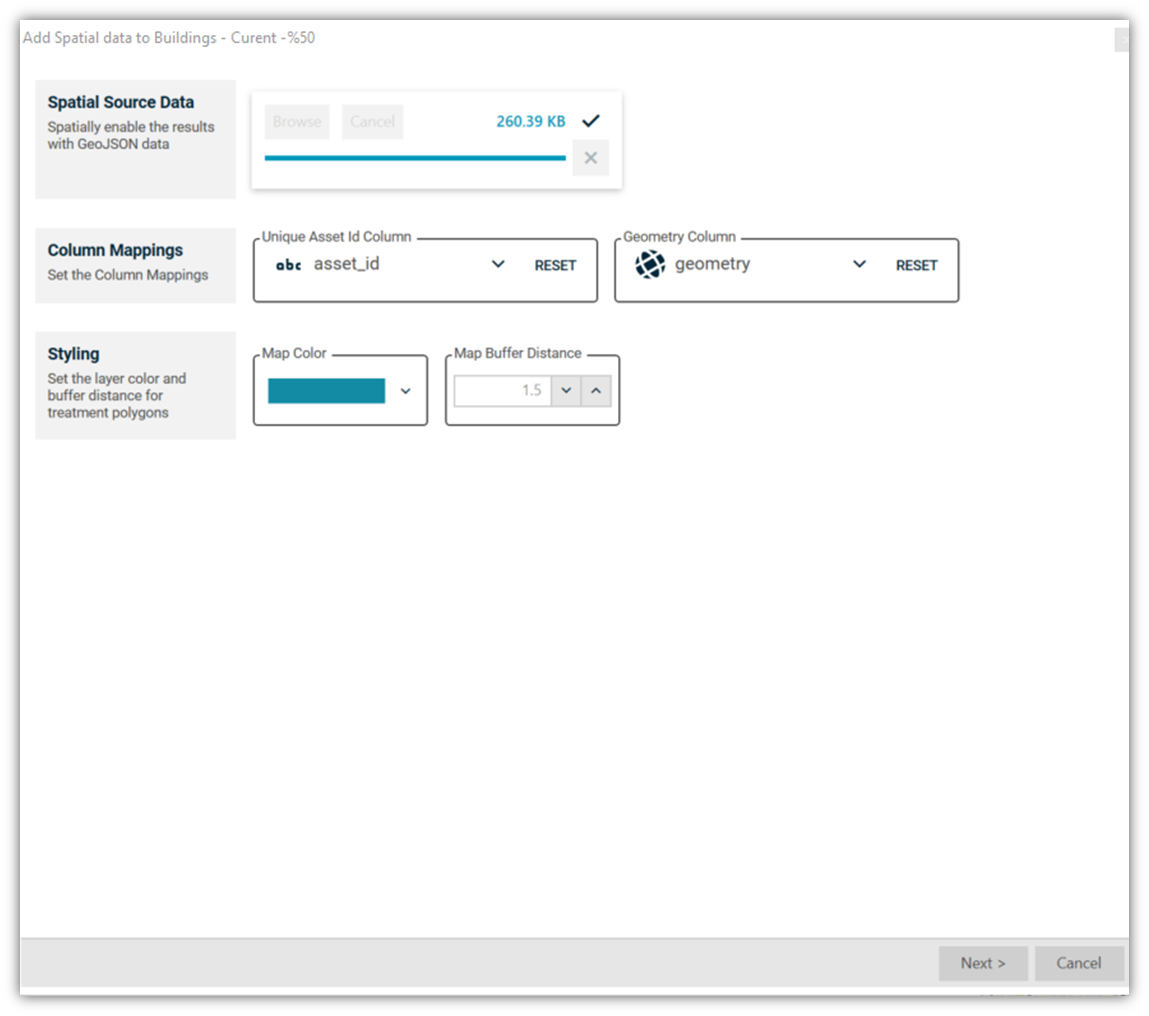
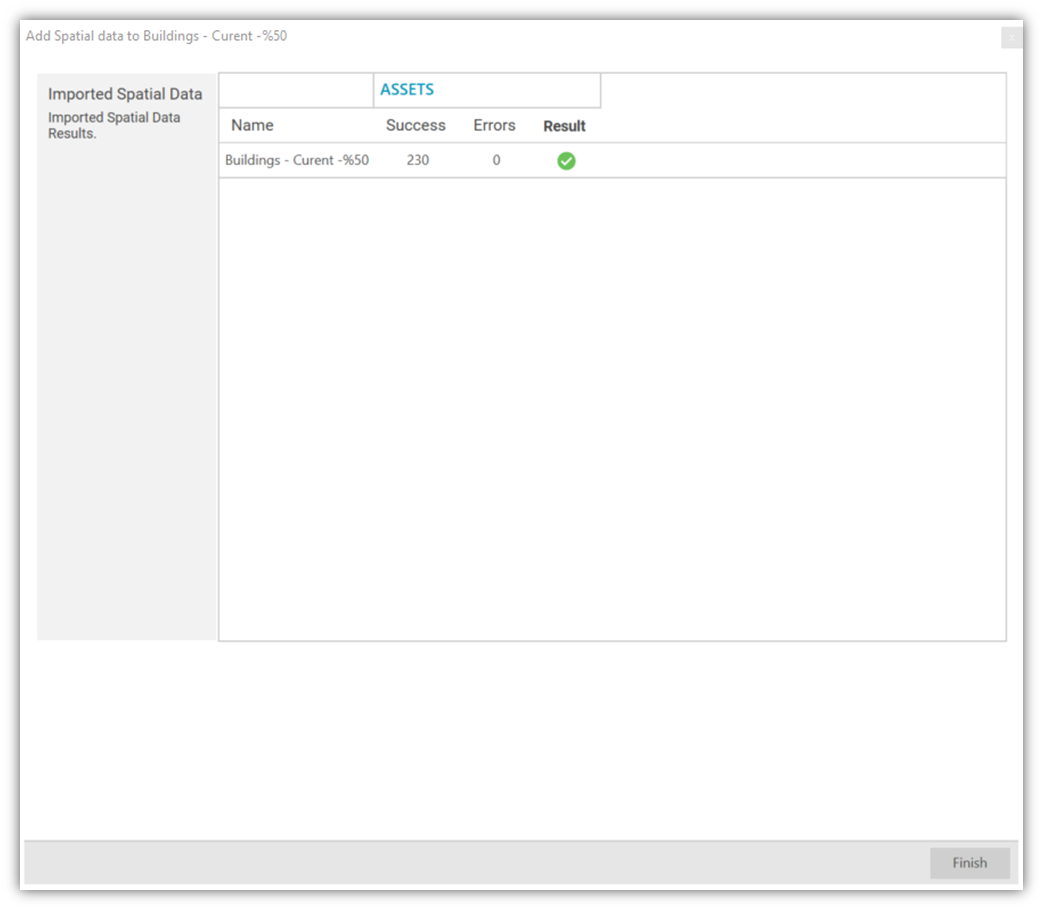
- Check the status of the imported spatial data and click on the "Finish" if there are no errors.
Note 1: The accepted projection of the GeoJSON file is WGS84 (World Geodetic System 1984).
Note 2: The spatial data should contain the unique asset ID field similar to the asset data in the predictor model. - Repeat steps 3 to 9 to import all desired data sources that you need to include in your planning.
Note: When selecting subsequent Simulations after importing the first, it is recommended that you choose only one simulation per Predictor Data Source and that each simulation chosen should have the same number of years. - The map layers for the selected simulation will be generated and displayed on the map.
Note: The treatments are time filtered for a four years timeframe. - Switch to the ArcGIS Pro "Content" pane (illustrated below). You will see the list of all data layers that have been added to the Work Planner project in ArcGIS Pro. Navigate to the "Map" tab and add/update the desired base map from the "Layer" group.
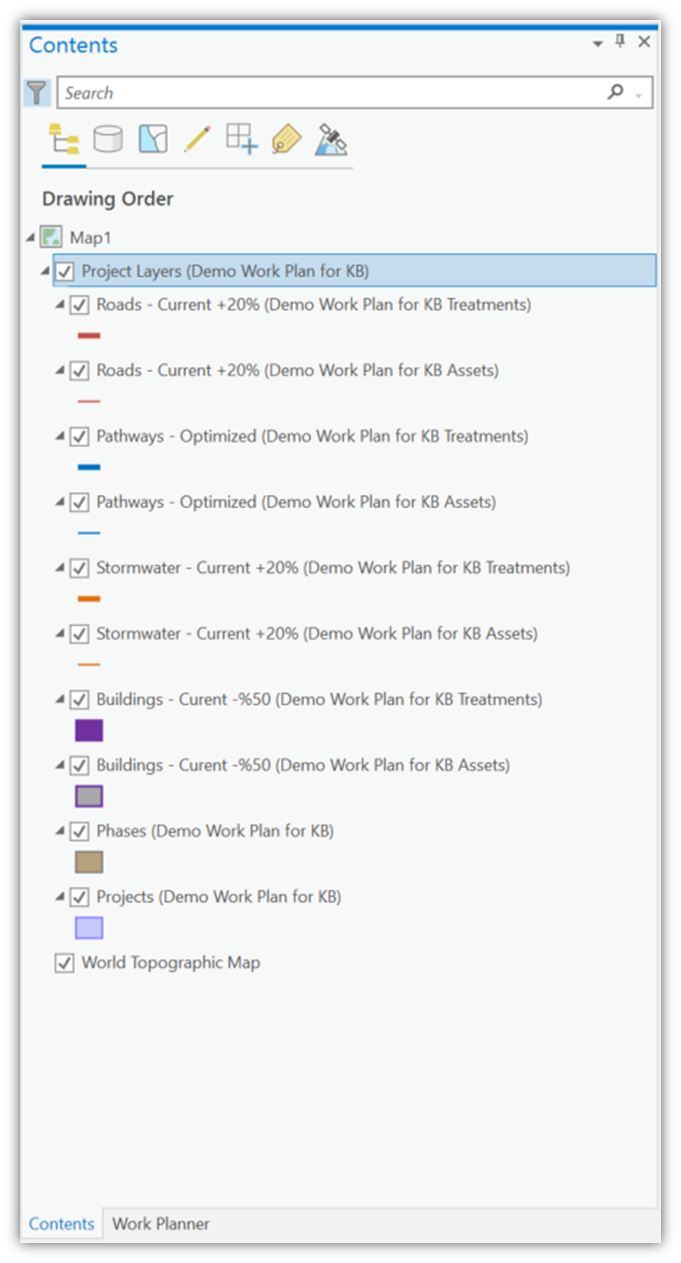
Note 1: There are two sets of spatial data imported for each asset type, including "Assets" and "Treatments". The Treatments layer is a time-enabled layer with features for every treatment from the Simulation. The Assets layer contains features for every asset in the simulations without a time reference. This layer configuration allows the user to add Treatments as modelled in Predictor and the ability to add Assets (and assign Treatments) to a Project in Builder.
Note 2: You can update the colors of the Data Source layers through the Data Sources tab in the Work Planner pane or through the ArcGIS Pro "Content" pane with the ArcGIS Pro Symbology tool. These settings are applied in ArcGIS Pro, and thereby allow each user to set up their preferred symbology settings.
